| Relative Attributes for Large-scale Abandoned Object Detection |
|---|
Effective reduction of false alarms in large-scale video
surveillance is rather challenging, especially for applications
where abnormal events of interest rarely occur, such
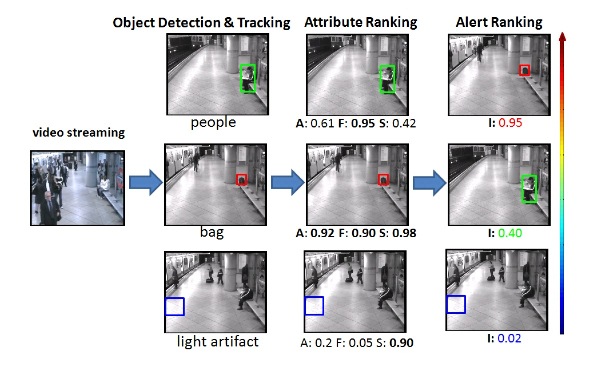
as abandoned object detection. We develop an approach
to prioritize alerts by ranking them, and demonstrate its
great effectiveness in reducing false positives while keeping
good detection accuracy. Our approach benefits from a
novel representation of abandoned object alerts by relative
attributes, namely staticness, foregroundness and abandonment.
The relative strengths of these attributes are quantified
using a ranking function learnt on suitably designed low-level
spatial and temporal features.These attributes of varying
strengths are not only powerful in distinguishing abandoned
objects from false alarms such as
people and light artifacts, but also computationally efficient
for large-scale deployment. With these features, we apply
a linear ranking algorithm to sort alerts according to their
relevance to the end-user. We test the effectiveness of our
approach on both public data sets and large ones collected
from the real world. This has been a joint work with Quanfu Fan
and Sharath Pankanti, Exploratory Computer Vision Group,
IBM T J Watson Research Center. Following is a link to a
related paper.
Quanfu Fan, Prasad Gabbur and Sharath Pankanti,
Relative Attributes for Large-scale Abandoned Object
Detection,
Proc. Intl. Conf. on Computer Vision, 2013.
Online Kernel SVM Ranking Software
During the course of this work,
I developed a Matlab package for learning ranking functions using a kernel
SVM ranker based on the LASVM (Bordes et al., JMLR 2005) online
learning algorithm. It is fairly optimized and is perhaps the only Matlab implementation
using the LASVM approach (at the time of writing this note). It has a few
speed and memory optimizations using mex functions for kernel functions
and kernel caching. It also has a support vector pruning method based on
the principles of Sequential Minimal Optimization (SMO) for efficient
(time and memory) training when the upper limit on the number of support
vectors is known. It can be downloaded from here.
| Retail Video Analytics |
|---|
Video surveillance and analytics have played a pivotal role in deterring threats
posed by anti-social elements on public facilities such as airports, government
buildings and even military installations. They have a great potential in enforcing
compliance in private establishments such as retail stores. A major source of
revenue shrink in retail stores is the intentional or
unintentional failure of proper checking out of items by the cashier.
More recently a few automated video surveillance systems have been developed to
monitor cashier lanes and detect non-compliant activities.
These systems use
data from surveillance video cameras and transaction logs (TLog) recorded at the
Point-of-Sale (POS).
Approaches that make use of only the statistics of the
TLog data to detect abnormal events within transactions tend to have a high
false positive rate compared to video-based systems. On the other hand,
video-based systems visually
monitor the activities of a cashier around the Point-of-Sale to detect item
checkouts and verify them using transaction log (TLog) data. Being able to
detect as many
non-compliant events as possible while keeping the number of false alarms low
is key to the successful deployment of these systems. It is a challenging problem
to optimize the two conflicting objectives due to variations and noise within
the input data streams.
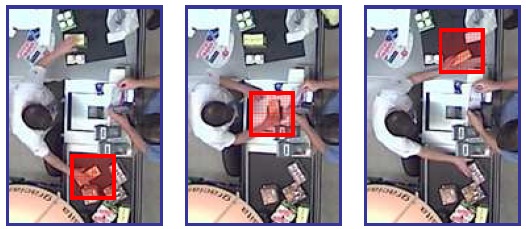
One of my research contributions in the above area includes a text-based
approach to analyzing videos represented as time-ordered discrete features,
working as a part of the Exploratory Computer Vision Group
at the IBM T.J. Watson Research Center. Instead of using the two streams (video
and TLog) of data separately, we
posit that much can be learned about the nature of an item scan performed by a
cashier by combining them into a single stream. This is because most item
checkouts are normal (no fraud) and a barcode is registered in the TLog.
By analyzing visual information around the registered barcode events, it is
possible to model variations in the cashier's activities for checking out an
item. This is helpful in detecting non-compliant cashier activities more
robustly in the presence of noise in either the TLog or the video data.
Taking a different perspective, this work aims to open up new possibilities for
looking at video data in a different light in order to infer useful knowledge.
Text-based algorithms are simpler and faster than many sophisticated video
analysis techniques but their potential in addressing some of the vision
challenges is yet to be fully explored. Following is a link to a related paper:
Prasad Gabbur, Sharath Pankanti, Quanfu Fan, and Hoang Trinh,
A Pattern Discovery Approach to Retail Fraud Detection,
Proc. 17th ACM SIGKDD Intl. Conf. on Knowledge Discovery and Data Mining, pp. 307-315, 2011.
| Machine Learning and Microarrays |
|---|
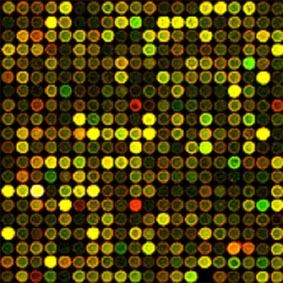
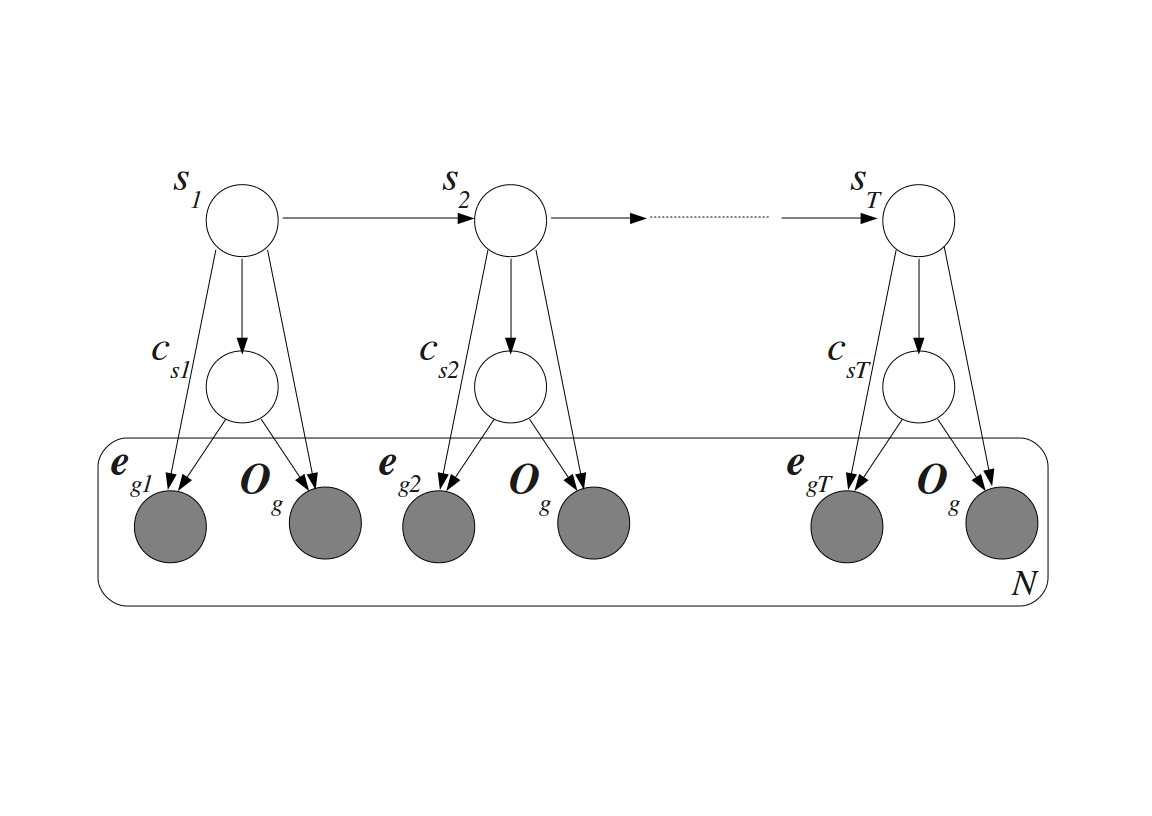
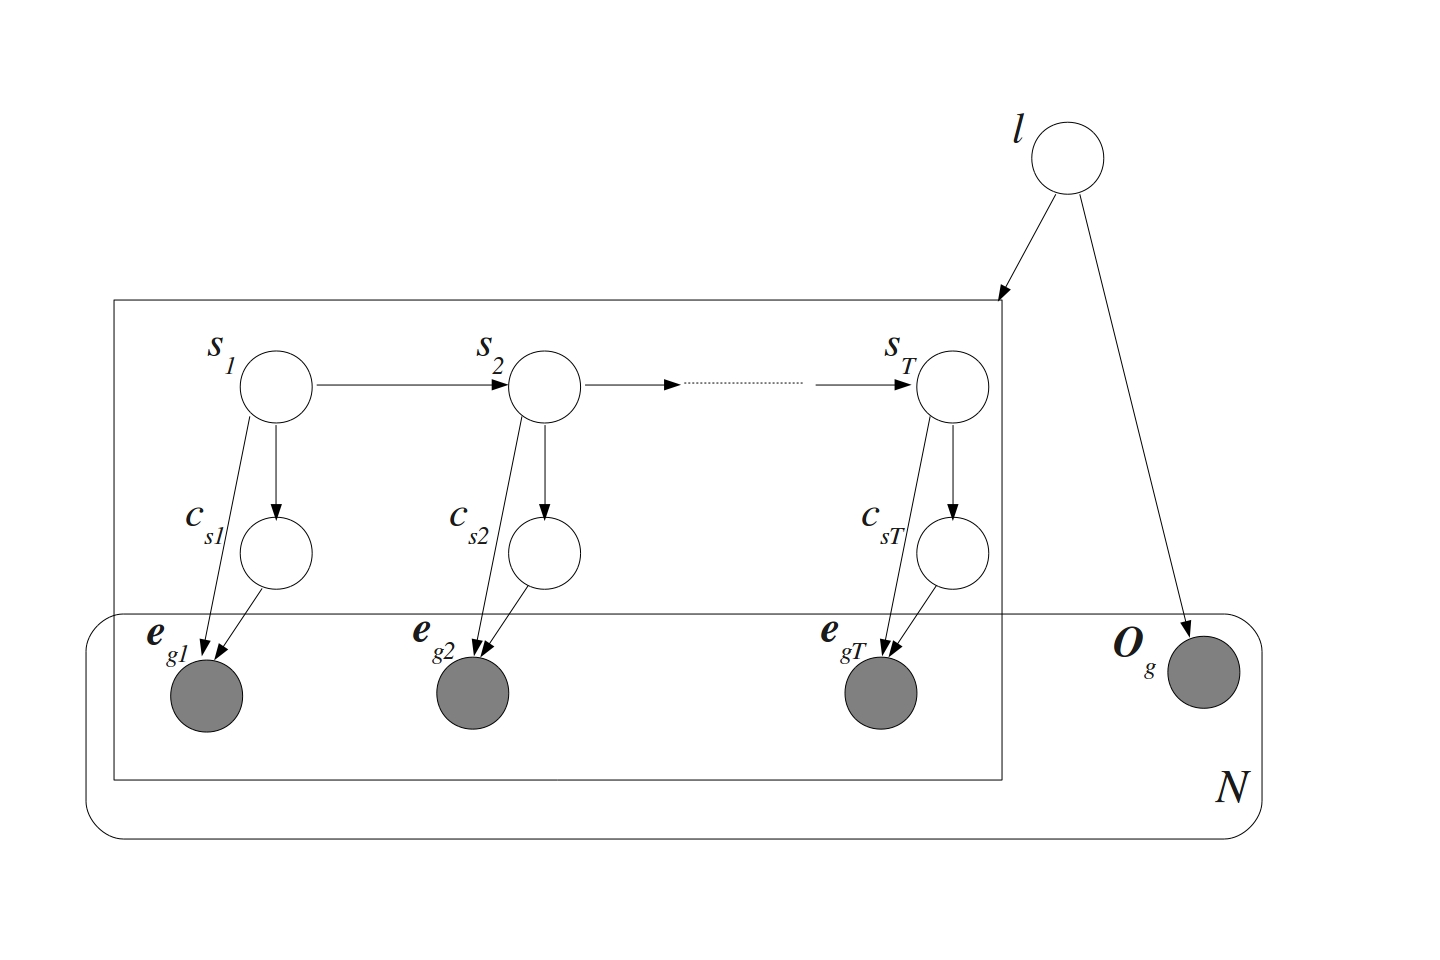
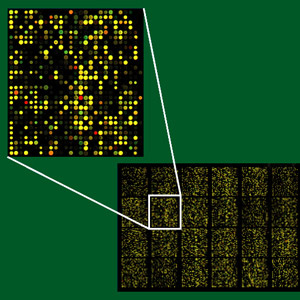
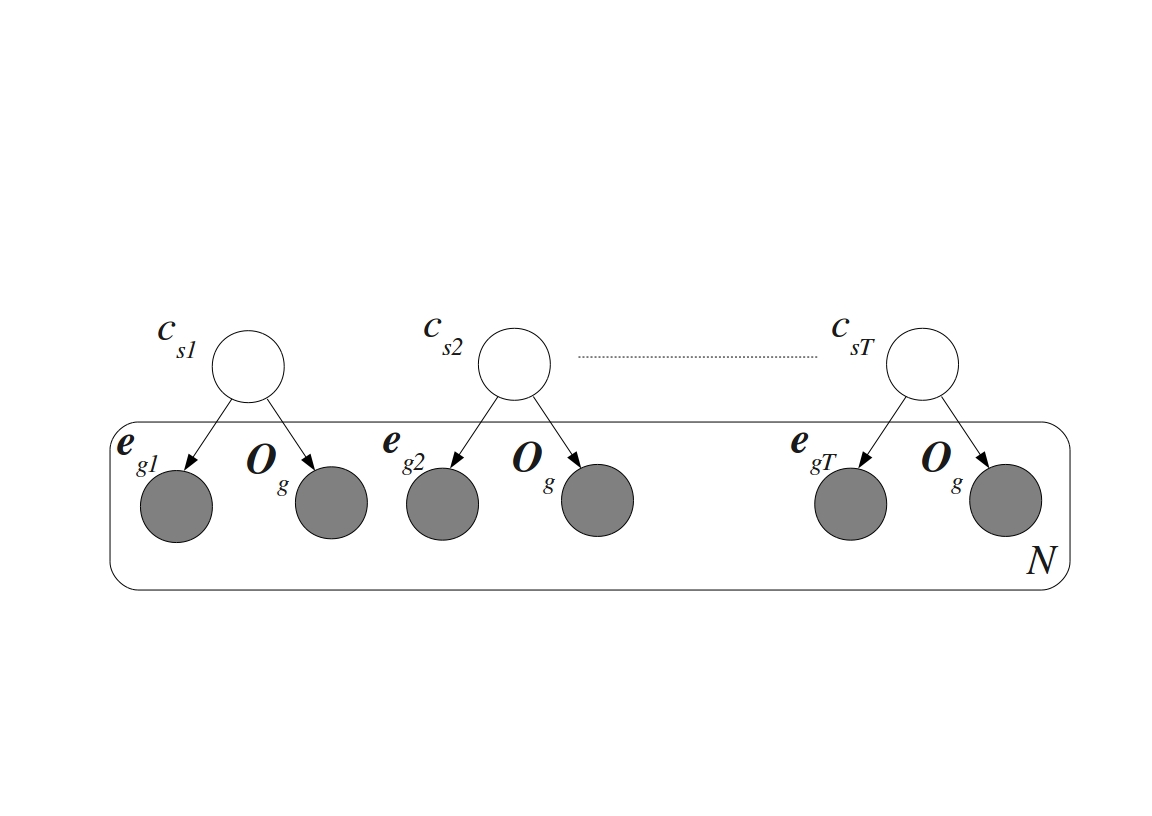
Microarrays were invented in the 1990s as a consequence of the efforts to speed up the process of drug discovery. The lengthy and expensive process of trial-and-error based drug discovery could be parallelized by synthesizing polypeptide sequences combinatorially from their basic building blocks--amino acids. A group of scientists at Affymax developed a photolithographic technique to accomplish this in a fashion similar to the synthesis of VLSI (Very Large Scale Integration) chips in the semiconductor industry. By being able to selectively lay out particular amino acids at specific sites on a glass slide layer-by-layer, with the help of photo-protective masks, they syntesized spatially addressable polypeptide chains on the slide. This gave rise to the idea of synthesizing similarly spatially addressable nucleic acid chains from their building blocks--the four nucleic acid bases (A, T, G, and C). The first version developed by the sister company Affymetrix came to be known as the GeneChip. Simultaneous to the efforts of Affymetrix in developing the GeneChip, researchers at Pat Brown's lab of Stanford University developed a different type of microarray. They devised spotted microarrays by depositing small amounts of probe cDNA sequences at particular locations on a substrate. Regardless of the technology, microarrays make it possible to monitor the expressions or expression profiles of thousands of genes together. This enables identifying genes involved in the regulation of important biological processes. Observing the co-expression between genes allows determining interactions between them that work towards regulating a particular biological process.
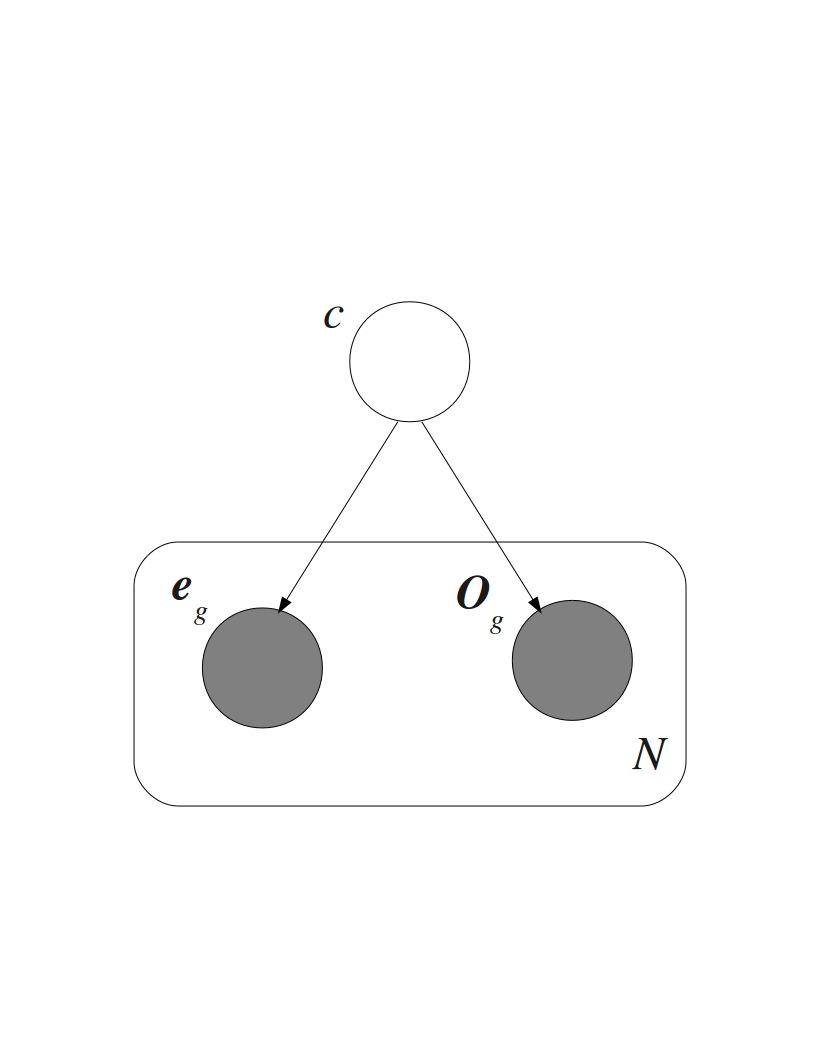
Methods for analyzing microarray data including normalization, gene selection and phenotypic state prediction have to account for both technical and biological noise in the data. I am working on evaluating the effectiveness of existing methods and developing novel methods to address these issues. New methods to incorporate Gene Ontology (GO) tags for state prediction are being explored with the help of probabilistic generative models for multimodal data. Phenotypic state prediction performance is being used to evaluate these methods. This was part of my PhD dissertation (see below). Paper and software coming soon!
Courtesy of CSIRO and MicrobiologyBytes for the microarray images
(in color) above.
Prasad Gabbur, Machine Learning Methods for Microarray Data Analysis, University of Arizona, Electrical and Computer Engineering
department, PhD Dissertation, 2010.
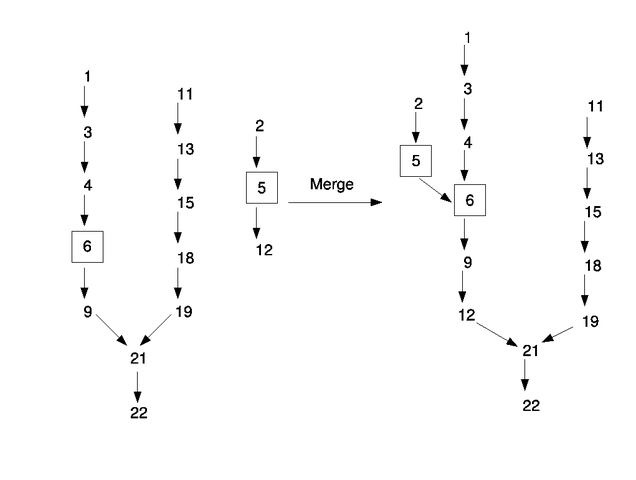
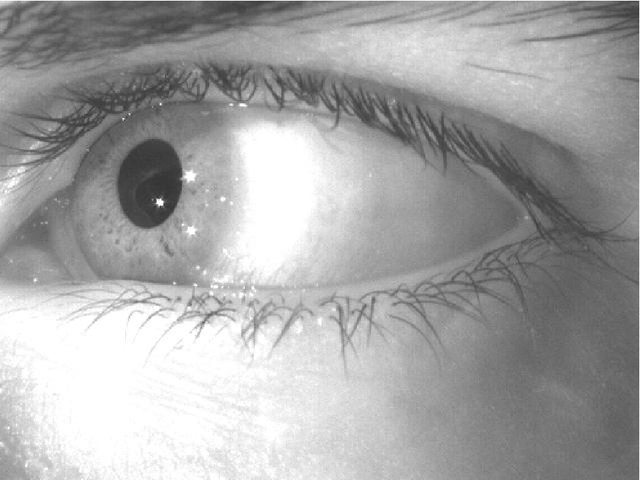
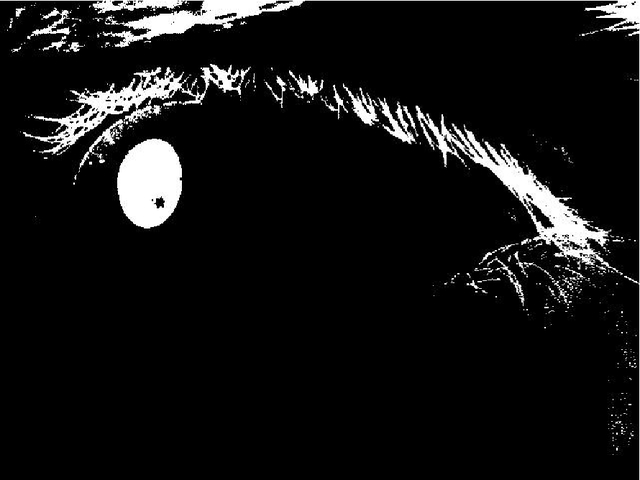
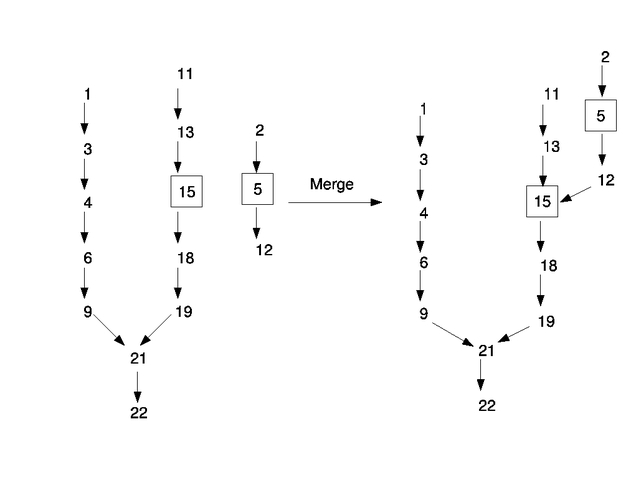
| Fast Connected Components Labeling |
|---|
Connected components labeling and extraction is a useful initial step in many computer vision applications. Grouping spatially connected pixels together achieves compression of the available information from an image in a way useful for certain tasks such as object identification and shape analysis. Traditional approaches to labeling are computationally expensive. This is mainly due to doing multiple image scans to group parts of a connected region together, which are easily extracted individually. Over time, the time-intensive repeated image scan problem has been addressed with improved algorithmic approaches. Many of these resort to storing additional information during the first image scan, sometimes with the help of predesigned data structures. This enables grouping of sub-regions of a component without an additional pass. We have developed one such fast connected components labeling algorithm using a region coloring approach. It computes region attributes such as size, moments, and bounding boxes in a single pass through the image. Working in the context of real-time pupil detection for an eye tracking system, we have compared the time performance of our algorithm with a contour tracing-based labeling approach and a region coloring method developed for a hardware eye detection system. We found that region attribute extraction performance exceeds that of these comparison methods. Further, labeling each pixel, which requires a second pass through the image, has comparable performance. For more details, a paper describing our proposed algorithm is available online. The original publication is available at "www.springerlink.com".
| Shift Expectation Maximization |
|---|
It is the usual assumption in multidimensional clustering that data points are aligned with
each other. But this does not hold true in many real world datasets. This poses a problem to
clustering algorithms, especially ones that adopt a probabilistic mixture modeling approach.
Misalignment of the data points tends to increase the estimated variances along the feature
dimensions. It might also lead to an artificial increase in the number of mixture components
required to fit the data. One such scenario arises in the clustering of action potentials
(spikes) recorded from the brains of insects or monkeys where the goal is to assign spikes
arising from a single cell or unit to a unique cluster. Usually different spikes from a single
cell are not aligned with each other due to imperfections in the measurement device. Another
scenario is the grouping of images of similar objects with the objects at possibly different
positions in the those images. The Expectation Maximization framework for estimating the
parameters of a mixture model provides a way to handle misalignments. This is done by
introducing shift as a hidden variable in the generative model for the data and assuming
misalignments are due to the unknown random shifts. We have realized this for the case of a
Gaussian mixture model assuming a finite number of discrete random shifts independent of the
clusters. Clustering is performed in a reduced dimensional space within which it is possible to
align the data points by reversing the shifts that might have occured when the points were
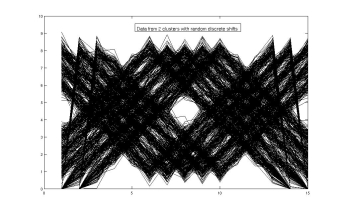
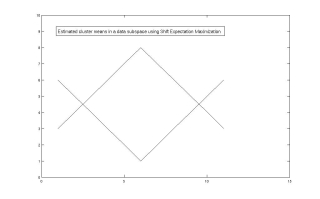
being generated. The plot on the left above shows synthetic data points generated from a mixture
of two Gaussians with means resembling an upright and an inverted triangle in a 15 dimensional
space and then randomly shifted. The cluster means in a suitable data subspace obtained using
our Shift Expectation Maximization algorithm are shown on the plot to the right. We are planning
to apply this to neuronal spike datasets recorded from insect brains to cluster them accounting
for possible misalignments.
| Competitive Expectation Maximization |
|---|
Expectation Maximization is a commonly used optimization technique in the machine learning
community to handle missing data problems. A typical application of this algorithm
is in fitting a probabilistic mixture model to a set of data points, eg., a Gaussian
Mixture Model (GMM). To seek the Maximum Likelihood (ML) estimate of the parameters of
the mixture model, the optimization problem is cast as a missing data problem and EM is
used to seek the ML estimate. However EM, being a hill-climbing technique, does not always
lead to the global ML estimate. Depending on the starting point it converges to a nearby local
maximum making it sensitive to initialization. Another problem in modeling a data set using a mixture
model is to automatically estimate the appropriate number of components in the mixture model. To
address these issues, a technique called Competitive Expectation Maximization (CEM) was proposed in
this paper. Working with Kobus Barnard,
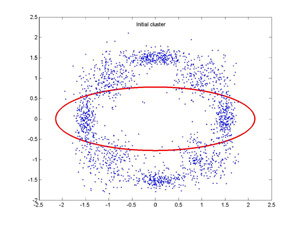
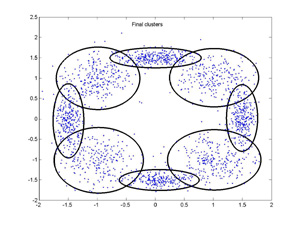
I have tried to implement a variant of CEM following the spirit of the paper. The above plots show the
initial and final GMM configurations for a synthetic data set using our implementation of CEM. The
final solution is close to the configuration of the GMM that generated the data. This can be applied
to any kind of mixture model employing EM as the optimization procedure to automatically estimate the
number of mixture components and seek the global ML solution with a high probability. Using our implementation, the following clips help
in visualizing the process of automatic selection of number and configuration of clusters for the above synthetic data set starting from
two different randomly initialized configurations. Observe the sequence of cluster split, merge and annihilation operations as the
algorithm proceeds in time!
From 1 to 8 clusters
From 20 to 8 clusters
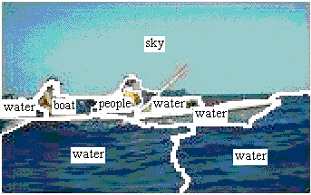
| Semantic Evaluation of Features Using Word Prediction Performance |
|---|
Research in the field of multimedia indexing and retrieval has tried to
exploit the semantic information carried by keywords attached to images. There
exist huge databases of images that come with words describing the context of
each image. The semantic information carried by the words associated with images
can be very helpful in organizing and indexing the data. Since these words
describe the content of the images - individual objects or their characteristics
- there exists a correlation between them and the visual features computed from
the images. Models have been introduced to extract this correlation structure
between words and features with the help of clustering methods that learn the
joint statistics of image words and segments. The very fact that words and
images can be modeled using a joint probability distribution has given rise to a
new application called "auto-annotation". It is the process of attaching words
to pictures automatically. The predicted words are indicative of scene
semantics. This can be viewed as a method of general object recognition
performed as machine translation from the object's visual representation to its
verbal description. The annotation performance can be measured by comparing
predicted words to words that are already associated with the test images.
Furthermore the availability of such labeled databases makes it possible to
test the performance on a large scale and obtain reliable performance measures.
The focus of my work is to use this auto-annotation performance measure to
evaluate suitable feature combinations. For further details, here are a few links:
Keiji Yanai, Nikhil V. Shirahatti, Prasad Gabbur, Kobus Barnard, Evaluation Strategies for Image
Understanding and Retrieval, Proc. of ACM Multimedia Workshop on Multimedia Information Retrieval (MIR), Singapore, November, 2005
(Invited paper).
Kobus Barnard, Pinar Duygulu, Raghavendra Guru, Prasad Gabbur, David Forsyth, The effects of segmentation and
feature choice in a translation model of object recognition, Proc. IEEE Conf. on Computer Vision and Pattern Recognition, Vol.
2, pp. 675-682, 2003.
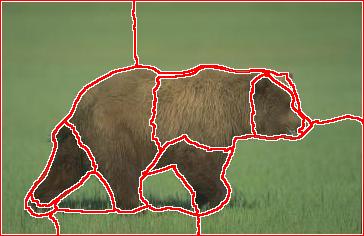
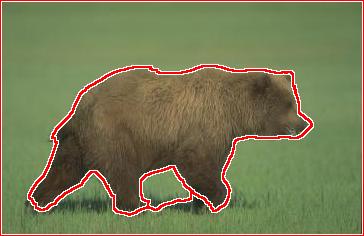
| Modifications to Normalized Cuts segmentation algorithm |
|---|
Normalized Cuts is a grouping criterion that aims to partition a set
of points into coherent subsets, originally developed by the Berkeley segmentation research group. It follows a graph theoretic approach
to partition a point set. Given a similarity measure (affinity) between each pair of points in the set, it tries to group together
points that have large affinity between each other. This criterion has been applied to the domain of image segmentation. A possible
approach is to treat each pixel in an image as a point in some arbitrary feature space and group together those pixels that are very
similar to each other according to the features chosen. I have worked on modifying a few aspects of a version of Normalized Cuts
segmentation algorithm to achieve better grouping of regions in natural images. Results of this work have formed a part of my
Masters thesis:
Prasad Gabbur, Quantitative evaluation of feature sets, segmentation algorithms, and color constancy algorithms
using word prediction, University of Arizona, Electrical and Computer Engineering department, Masters thesis, 2003.
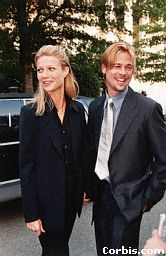
| Face Detection/Tracking in Color Image Sequences |
|---|
The idea of using physical attributes viz., face, fingerprints, voiceprints or any of several other characteristics to prove human identity has a lot of appeal. Any trait of human beings that is unique and sufficiently stable can serve as a distinguishing measure for verifying, recognizing or classifying them. Face is one such attribute of human beings that clearly distinguishes different individuals. In fact, face is the attribute that is most commonly used by human visual system to identify people. This gives us the cue as to why research has been aimed at developing computational systems for automatic face recognition. Automatic face recognition is a process of identifying a test face image with one of the faces stored in a prepared face database. Real world images need not necessarily contain isolated face(s) that can directly serve as inputs to a face recognition (FR) system. Hence, there is a need to isolate or segment facial regions to be fed to a FR system.It may be felt that face detection is a trivial task. After all, we human beings, do this in our daily lives without any effort. The human visual system can easily detect and differentiate a human face from its surroundings but it is not easy to train a computer to do so. My work involves detection/segmentation and tracking of faces in color image sequences with complex backgrounds. Skin color is the main cue for detecting face(s) using appropriate mixture models for estimating underlying skin color distribution. For further details, here are a few links:
Prem Kuchi, Prasad Gabbur, P. Subbanna Bhat, Sumam David S., Human Face Detection and Tracking using Skin Color
Modeling and Connected Component Operators, IETE Jl. of Research, Vol. 38, No. 3&4, pp. 289-293, May-Aug 2002.
Prasad Gabbur, Detection and Segmentation of Human Faces in Color Images with Complex Backgrounds, detailed project report as a requirement for the ECE532 Computer Vision course, Fall 2001.
| Color Constancy in a Translation Model of Object Recognition |
|---|
Color is an extremely useful feature for characterizing and recognizing objects. It has been studied in detail for specific recognition
tasks such as skin. Color is also possibly the most useful of the features typically used in a content-based image retrieval (CBIR)
system. However the color of a scene depends on the color of light illuminating the scene. In other words the same object can appear
to be differently colored if viewed under lights having different spectral components (different colors). This poses difficulty to
systems that use color as a cue in recognizing objects. Two different approaches can be taken to deal with this problem. One would be
to make the system learn about different lighting conditions it can encounter by presenting it with exemplars under those conditions.
The other would be to remove the effects of illumination color and obtain an illumination independent description of the scene. This is
essentially the goal of computational color constancy algorithms. These algorithms attempt to estimate the illumination color of a
scene or obtain an illumination independent description of the scene that more precisely reflects its physical content. I am working on
evaluating the two approaches using the same translation model of object recognition. In this model, objects in a scene are recognized
by predicting words for the scene automatically, given a set of visual descriptors for the scene. The translation model learns correlation
between visual descriptors and words using a large annotated image database. Preliminary evaluation results using simple color
constancy algorithms and details of the experiments can be found in the following paper:
Kobus Barnard, Prasad Gabbur, Color and Color Constancy in a Translation Model for Object Recognition,
Proc. IS&T/SID 11th Color Imaging Conference, pp. 364-369, 2003.