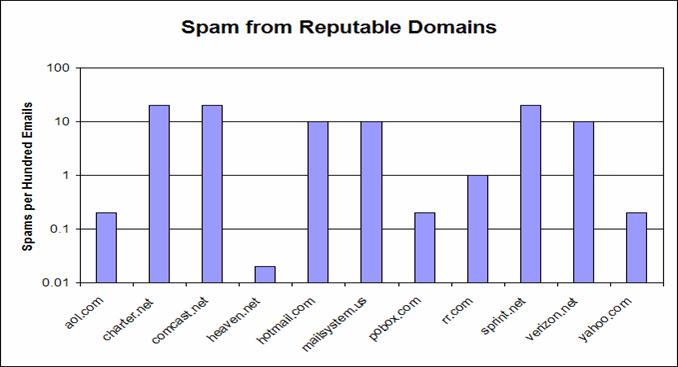
Here is a sample plot of data from receivers using the Registry (with hypothetical data for now).
Here is some real data from a small sample of Spamcop reports.
There are substantial differences in the % of spam
coming from different domains, like a factor of 100!!
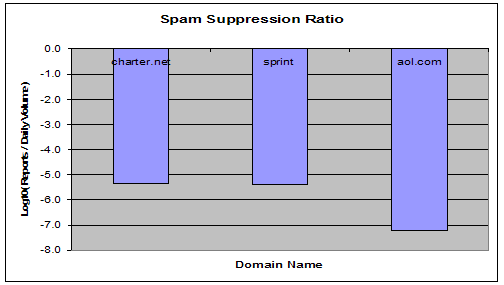
Daily Spamcop Suppression
Magnitude Volume Reports Ratio
charter.net 6.7 7.9E+06 37 -5.3
sprint.net 3.0 Network owner unknown. ???
sprint 7.0 1.6E+07 70 -5.4 all 484 domains owned by sprint
aol.com 7.8 1.0E+08 6 -7.2
Magnitude is from senderbase.org = log10( domain volume / internet total )
Daily Volume = 1.6E10*10^(Magnitude-10)
Suppression Ratio = log10( Spam Reports / Daily Volume )
Extracting spam scores from these reports is difficult.
- Its a small sample with a lot of uncertainty.
- We can't get an absolute ratio (% of spam) because we are comparing spam reports sent to one company vs another company's estimate of the worldwide volume from that domain.
Nevertheless the conclusion is firm. Some domains are much better than others. We just need to get this information into a form that email receivers will understand and take action. Senders will then discover that cleaning up their outgoing mail was not so difficult after all.