Comment:
This page covers the use of psychrometric charts to determine the enthalpy for a water-air system. From an energy balance point of view, it functions just as enthalpy tables do for obtaining enthalpies for different compounds, and as steam tables did for water vapor. However, this chart is used specifically for water vapor - air systems. It is just a composite of empirical correlations of different properties. It allows us to get the enthalpies for an air-water vapor system not only directly from temperature, but also from other properties that are functions of temperature. That is, it allows us to obtain enthalpies from dew point temperature and relative humidity (as an example), or from the humid specific volume and wet bulb temperature. On this page, the focus is on how to read and use the chart.
Explanation:
As engineers, we have probably become comfortable with using two dimensional plots. Psychrometric charts can seem more confusing because they offer several more axes on one graph instead of just two. But this also allows us to determine several properties for a gas-vapor mixture simultaneously. Take the following:
where the actual water vapor - air psychrometric chart forms a continuum of lines. The chart relates the mixture's enthalpy to Tdp, Twb, ha, hr, and specific volume. Given a combination of these properties, we would be expected to determine the enthalpy. The technique is the same for any combination of properties given. When you are given any two properties that appear on the chart, then you can find a point on the graph. Once you get that point, you gain access to several other properties (such as enthalpy) by following along the other axes.
Reading the chart:
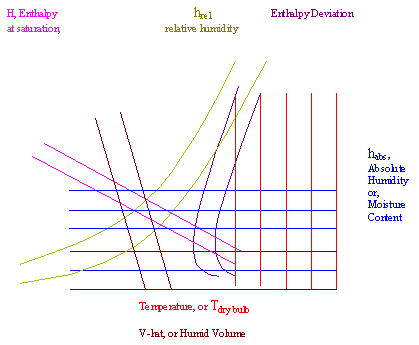
hr Relative humidity. This is the green-olive colored curves, which range from 10 to 100%.
ha Absolute humidity. a.k.a. moisture content, is the vertical axis, with the blue lines representing it is constant along the line.
Humid Volume or Specific Volume. The brown diagonal lines, with values read under the temperature values on the horizontal axis
Saturation curve This is the relative humidity equal to 100% curve. Along this curve, the system air is saturated with water vapor.
Tdb Temperature of the dry bulb. The horizontal axis, where red lines constitute isotherms, or lines where it is constant. This is the actual temperature of the system, such as one measured by a standard mercury thermometer.
Twb Temperature of the wet bulb. This curve is the saturation curve for -5 degC < Twb < 34 oC, and the uppermost horizontal curve at higher temperatures. This is the temperature of some altered thermometer, which is not the actual temperature of the system (well, at low temperatures it is, but at high temperatures it is not.
Tdp Temperature of the dew point. The temperature on the saturation curve. On this saturation curve, its values are read from the same values as is the wet bulb temperature, but, as explained below, I am not saying that the value of Tdp and Twb for a system are the same, because they aren't. However, the scale for both is the same.
From any point on the chart, we can find everything!
Given a point:
For T or Tdb, move vertically from our point and read this temperature from either the lowermost horizontal axis, or the uppermost boundary of the chart (the saturation curve or the uppermost horizontal curve for high temperatures).
For Twb, move along the constant enthalpy curve (upleftward) from our point until it intersects the saturation curve, then read the value at the saturation curve.
For Tdp, move horizonally (leftward) from our point until it intersects the saturation curve, and read the value there.
For hr, interpolate between the hr curves that surround the point.
For ha, move horizontally (rightward) from our point, until you reach the rightmost axis, where the value is read.
For specific volume, move towards the lower right parallel to the volume lines (rightdownward) until you reach the lower most horizontal axis, where the value is read on a scale below the temperature values.
For H, the enthalpy, if we are at saturation, let's call this Hsat, move along the pink lines (upleftward) and read the value from the upleftmost scale. If we are not at saturation, determine the enthalpy deviation by interpolating between the deviation enthalpy curves (purple) that bound the point. Then, for an unsaturated mixture, we simply add this value (a negative number) to Hsat.
If a problem gives us values for two of these properties, we can find the point at which the lines of those values intersect. From that point we can extract any of the other parameters for the system in that state.
Notes:
If a process transfers energy adiabatically, we would move along the constant enthalpy curve from our point to determine the conditions at another point.
If a process transfers energy by heat, we move horizontally leftward from our point to determine the enthalpy.